Project Management
In this chapter, we will develop our project management approach by describing several aspects such as the scope, time, project plan and our understanding and use of Jira, particularly with sprints.
Scope
Defining the scope of the Healing Cocoon is essential for keeping our multidisciplinary efforts focused on the project's core objectives: reducing children's anxiety and transforming clinical waiting rooms into calming, immersive spaces. The scope of our project focuses on the research and development of a solution up to the proof-of-concept stage. This involves focusing on the structure, design, materials, app, and smart devices. While the final product is intended for specialized pediatric clinics, our current technical focus is on building a working prototype to prove our technology and sensory integration work effectively.
To prevent scope creep and ensure a clear roadmap from conceptualization to final deployment, we have systematically organized our tasks. The Work Breakdown Structure (WBS), Figure 1 presented below illustrates how we have divided the project into manageable phases—Management, Research, Design, Development, Testing, Marketing, and Reporting—and their specific deliverables. This framework ensures that every team member understands their responsibilities and the steps required to deliver a safe, inclusive, and fully functional prototype.

Time
To make sure we finish this project within the 15-week semester, we break our work down into small, weekly goals. We use task-tracking software to organize who is doing what every week. This flexible approach allows us to design the physical pod and write the software at the same time. While our weekly tasks are flexible, we make sure to always pay attention to the major deadlines and closely monitor progress over time.
Here the details of the milestones of our project:
2026-02-28 Choose and share top-3 preferred project proposals via email (epsatisep@gmail.com)
2026-03-11 Upload “black box” System Diagrams & Structural Drafts to Deliverables
2026-03-18 Upload List of Components and Materials (Deliverables)
2026-03-21 Define the Project Backlog (what must be done and key deliverables - every member should preferably participate in every task), Global Sprint Plan, Initial Sprint Plan (which tasks should be included, who does what) and Release Gantt Chart of the project and insert them on the wiki (Report)
2026-03-25 Upload detailed System Schematics & Structural Drawings (Deliverables) and do the cardboard scale model of the structure
2026-04-12 Upload Interim Report and Presentation (Deliverables)
2026-04-16 Interim Presentation, Discussion and Peer, Teacher and Supervisor feedbacks
2026-04-22 Upload 3D model video (Deliverables)
2026-04-29 Upload final List of Materials (local providers & price, including VAT and transportation) to Deliverables
2026-05-02 Upload refined Interim Report (based on Teacher & Supervisor Feedback)
2026-05-13 Packaging solution (Deliverables and Report)
2026-05-27 Results of the Functional Tests (Report)
2026-06-13 Final Report, Presentation, Video, Paper, Poster and Manual (Deliverables)
2026-06-18 Final Presentation, Individual Discussion and Assessment
2026-06-23 Update the wiki, report (suggested corrections), upload refined deliverables in shared section of MS Teams (source and PDF), printed copy of the poster, brochure and leaflet for EPS coordinator
2026-06-25 Submit prototype and user manual, prototype demonstration
Cost
We need to clearly separate two different prices: the price of the final product and the budget we have right now. While the final Healing Cocoon will be sold to clinics for about 2000 € to 2500 €, our goal right now is just to build a working test model (prototype) to prove our technology works.
For this first prototype, the EPS program gave us a 100 € budget limit. To make sure we don't spend too much, we are using affordable, easy-to-find materials for the physical frame. For the smart system, we are using low-cost electronic sensors and a basic microcontroller (ESP32).
| Required component | Description | Total Budget (€) | Actual Costs (€) |
|---|---|---|---|
| Smart brain & sensors | ESP32 board, and sensors for light, carbon dioxide and humidity | 25.00 | 3.67 |
| Output devices | Scent sprayer, speaker amplifier, and relay switch | 25.00 | 22.98 |
| Power supply | 5 V 2 A USB wall plug | 25.00 | 7.26 |
| Building materials | Fiberglass rods, hula hoop, spandex, acoustic foam, PVC | 40.00 | (Pending purchase) 0.00 |
| Total prototype budget | 100.00 | 53.91 |
Quality
To make sure the Healing Cocoon is safe for children and works perfectly in a real clinic, we set clear quality goals. We constantly check our work through team reviews, teacher feedback, and physical testing.
1. Building & Hardware Quality
- Wheelchair access - The opening and inside of the pod must be big enough for a standard child's wheelchair to roll right in without the child needing to stand up.
- Cleanliness & Hygiene - All inside surfaces must be easy to wipe down and made of materials that stop germs from spreading. They must also survive standard clinic cleaning sprays without getting damaged. This will be done by checking the manufacturer's safety sheets and testing the materials with cleaning sprays.
- Fast Electronics - When the smart system (the ESP32) senses something, the lights, sounds, or scents must react in less than 2 seconds so the experience feels magical and natural. This is going to be tested by running the code and testing the electronics over and over to find any delays.
2. Structure and hardware quality
To make sure the Healing Cocoon is safe, reliable, and effective before being used in clinics or therapy spaces, our company will carry out several types of quality testing during development and before final deployment.
- Hardware quality - Every electronic feature of the cocoon will be tested repeatedly to confirm it works correctly. This includes checking the lighting system, sound system, scent diffuser, sensors, and the ESP32 smart controller. Each function must respond correctly without delays, freezing, or unexpected shutdowns. The entire hardware system will be tested by our company before being shipped. The tests performed will be those referenced in the Tests part of our report.
- Assembled cocoon quality - The cocoon must conform to the original dimensions and remain stable and safe after long periods of use. To ensure this, our company will conduct various tests detailed in Figure 2.

We are also focusing on clear and consistent report for keeping the track of our progress and milestones achieved. We use a final “cross-check checklist” before submission, ensuring all numbers, part names, and deadlines match across every single chapter.
People & Stakeholder Management
1. Definition of the people and stakeholders of the Healing Cocoon:
To make sure our project runs smoothly, we have clearly defined the roles of our internal team members and identified the external groups (stakeholders) who care about the success of the Healing Cocoon.
The Project Team (Internal) Our team is made up of six international students from different academic backgrounds. Because we have different skills, we divided the project responsibilities to match our strengths:
- Ronja Kruse (Dental Technology): Provides medical insights for the clinic environment, helps with B2B marketing, and designs the wheelchair-accessible layout.
- Hanna Kaczmarek (Industrial Biotechnology): Focuses on ergonomic dimensions, market analysis, and the business SWOT analysis.
- Anouc Goedhart (Industrial Design Engineering): Leads the 3D design models, branding (flyers/leaflets), and the visual identity of the Cocoon.
- Daniel Aagaard Pérez (Informatics Engineering): Handles the smart system hardware, projector integration, and the detailed technical schematics.
- Julie Bonnet (Packaging Engineering): Manages material selection, eco-efficiency research, and building the physical cardboard scale model.
- Kemal Yilmaz (Electronics - ICT): Develops the software app, the user interface (UI), and database management.
Key External Stakeholders These are the people outside our team who are impacted by our project:
- EPS Supervisors & Teachers: They guide our academic progress and grade our deliverables. We manage their expectations by meeting all deadlines and updating our Wiki logbook.
- Clinic Directors (The Customers): The private dentists and therapists who will buy the Cocoon. We manage them by proving the product is easy to clean and will save their clinic time and money.
- Patients & Parents (The Users): The anxious children and their parents. We manage their needs by ensuring the final pod is safe, calming, and inclusive.
- Local Suppliers: Companies like F. Marques da Silva and Artnovion who provide our materials.
2. Stakeholder Satisfaction Strategy:
The success of the Healing Cocoon depends on meeting the expectations of all stakeholders involved. To keep stakeholders satisfied, we will maintain regular communication, gather feedback throughout the project, and ensure that their needs are reflected in the final design.
Project Team Members Team satisfaction will be maintained through clear role allocation, weekly meetings, and shared project planning tools. Regular progress reviews will help identify challenges early, distribute workload fairly, and ensure that all team members can contribute according to their expertise.
EPS Supervisors & Teachers We will keep supervisors and teachers satisfied by meeting deadlines, maintaining an up-to-date Wiki logbook, attending scheduled meetings, and actively implementing their feedback. Draft reports and design updates will be shared regularly to ensure the project remains aligned with academic requirements.
Clinic Directors (Customers) Clinic directors are primarily concerned with safety, practicality, and return on investment. We will address these expectations by demonstrating that the Healing Cocoon is easy to clean, reliable, wheelchair-accessible, and capable of improving the patient experience. Feedback from clinic professionals will be incorporated into design decisions whenever possible.
Patients & Parents (End Users) The needs of children and parents are central to the project. Their satisfaction will be supported through a safe, calming, and inclusive design. User feedback sessions, observations, and surveys will be used to evaluate comfort, accessibility, and overall experience. Any concerns regarding safety, hygiene, or usability will be addressed during the design process.
Local Suppliers Strong relationships with suppliers will be maintained through professional communication, clear specifications, and timely requests for materials. Keeping suppliers informed about project requirements and deadlines will help ensure reliable deliveries and consistent material quality.
3. Measuring Stakeholder Satisfaction:
To evaluate whether stakeholder expectations are being met, we will use:
- Regular feedback meetings with supervisors and project mentors.
- Surveys or interviews with potential users and healthcare professionals.
- Progress reviews against project milestones and deadlines.
- Testing sessions to collect comments on usability, safety, and comfort.
- Documentation of stakeholder feedback and the actions taken in response.
By continuously collecting and acting upon feedback, the project team can ensure that the Healing Cocoon remains aligned with stakeholder expectations and delivers value to all groups involved.
Communications
Effective communication is essential for the success of the Healing Cocoon project, particularly given our multidisciplinary and multicultural team composition. To maintain transparency, ensure accountability, and streamline collaboration, we have established a clear communication strategy using a mix of real-time messaging, centralized project management, and formal channels.
- Communication channels
WhatsApp for internal team messaging
We utilize WhatsApp for daily, informal communication, quick check-ins, and immediate team coordination. This channel is reserved for urgent updates and fostering team cohesion.
Microsoft teams for document & meeting management
Teams serves as our central repository for all project documentation and deliverables. We use this platform to communicate with our EPS coordinators, store shared files, and manage meeting notes to ensure a persistent record of all collaborative decisions.
Outlook for formal communication
All official correspondence with our EPS coordinators, supervisors, and external project partners is conducted via Outlook. This ensures a professional and searchable audit trail for all high-level project agreements and milestones.
- Task Management
Jira for workflow tracking
We use Jira as our primary tool for monitoring project progress against our defined timeline. All daily, weekly, and monthly tasks are tracked here to ensure alignment with our project milestones. Jira allows every team member to see the status of their assigned tasks and provides a transparent view of the project backlog, ensuring we meet our critical deadlines.
- Meeting Strategy
Our meeting schedule is designed to balance progress monitoring with collaborative problem-solving:
Weekly Team Meetings
Held to review the status of our tasks in Jira, align on deliverables, and solve technical challenges.
Supervisor Check-ins
Formal meetings scheduled through Outlook or Teams to present our progress, review deliverables, and incorporate supervisor feedback into our design and development process.
Risk
This chapter identifies the risks that may arise during the Healing Cocoon project and defines how they will be prevented, monitored, and managed if they occur. Each risk is assessed on two dimensions: likelihood (how probable it is) and severity/impact (how damaging the impact would be). The product of these two gives a risk score, which determines the priority for mitigation.
Risk Classification
Risks are categorized by type to make it easier to assign ownership and response strategies:
- Project risks — affect schedule, scope, budget, or team capacity.
- Technical risks — affect hardware, firmware, software, or integration.
- Operational risks — affect day-to-day execution and infrastructure.
- Safety & environmental risks — affect user safety, child health, or clinic hygiene.
Likelihood and Severity Scales
The evaluation follows a 5×5 Risk Matrix based on PMBOK standards, where the exposure score is calculated by multiplying Probability/Likelihood (1–5) and Impact/Severity (1–5).
| Level | Likelihood / Probability | Severity / Impact |
|---|---|---|
| 1 | Improbable / Rare | Negligible / Insignificant |
| 2 | Remote | Marginal |
| 3 | Possible | Moderate |
| 4 | Likely / Almost Certain | Critical |
| 5 | Frequent | Catastrophic / Severe |
Risk score = Likelihood × Severity. Scores are interpreted as Figure 3:
- 1–4 Low: Acceptable; minimal monitoring.
- 5–9 Medium / Moderate: Manageable; requires routine control and active mitigation.
- 10–15 High: Significant; requires a specific mitigation plan before development milestones.
- 16–25 Extreme / Critical: Must be addressed immediately before the project advances.

Risk Register
The table below lists all identified risks for the Healing Cocoon, their assessment based on our specific project parameters (such as the 100€ EPS budget limit, material properties, and software structure), preventive strategies, and response plans.
| ID | Risk Description | Category | Likelihood | Severity | Score | Prevention Strategy | Response Plan | Owner |
|---|---|---|---|---|---|---|---|---|
| R01 | Tasks not completed on time / Sprint delays | Project | 3 | 3 | 9 | Realistic planning with buffer; strict weekly sprint reviews in Jira; early flagging of blockers. | Replan sprint; reprioritize backlog; reallocate resources. | Project Manager |
| R02 | Budget overrun (Exceeding the 100€ prototype limit) | Project | 2 | 4 | 8 | Component pricing confirmed before purchase; source affordable local materials (e.g., F. Marques da Silva, Artnovion). | Substitute cheaper components; deprioritize non-essential features. | Project Manager |
| R03 | Team synchronicity & communication issues | Project | 3 | 3 | 9 | Weekly standups; shared tools (Jira, Teams, Miro); strict adherence to the final cross-check checklist. | Address in retrospective; adjust communication rhythm; redistribute tasks. | Project Manager |
| R04 | Cross-contamination / Hygiene rejection (Surfaces transmit germs) | Safety & Env. | 3 | 4 | 12 | Explicitly use medical-grade, easily sanitizable antimicrobial textiles (e.g., Monteiro Fabrics MEDIFLEX collection). | Stop session; immediately wipe down with standard clinic sprays; review safety sheets. | Technical Lead |
| R05 | Claustrophobia / Panic inside the Cocoon | Safety & Env. | 2 | 4 | 8 | Keep the structure semi-enclosed (not fully closed) so parents maintain visual contact. | Press the physical or digital Emergency Stop button; immediately move the child out. | Technical Lead |
| R06 | Wheelchair accessibility failure (Inability to enter or fit) | Safety & Env. | 2 | 4 | 8 | Ensure the structural opening and footprint (165 cm x 110 cm) comply with barrier-free dimensions and design layout. | Utilize the removable seat feature and deploy the integrated ramp to facilitate immediate access. | Hardware Lead |
| R07 | Smart system responsiveness lag (ESP32 latency) | Technical | 2 | 3 | 6 | Write clean, non-blocking asynchronous JavaScript/C++ code; minimize data overhead. | Run code profiling; optimize loops; optimize LocalStorage and data structures. | Technical Lead |
| R08 | Power Supply Instability / Overload (High-draw components) | Technical | 2 | 4 | 8 | Dedicate direct power lines from the supply to high-draw components (projector, speakers) instead of drawing current through the ESP32. | Isolate affected unit; check schematics; replace the 5V 2A USB power adapter. | Hardware Lead |
| R09 | Sensor calibration drift / Environmental false readings | Technical | 3 | 2 | 6 | Use high-quality reference digital sensors (BH1750 for lux, DHT22 for air) rather than basic analog options. | Implement tolerance thresholds in firmware; clean sensor housings; replace faulty sensors. | Hardware Lead |
| R10 | Scent diffuser essential oil allergy / Irritation | Safety & Env. | 2 | 3 | 6 | Use strictly certified, organic, pediatric-safe diluted essential oils (lavender/orange); provide low-stimulation mode settings. | Shut down the ultrasonic atomizer immediately via the 5V relay module; activate airflow ventilation. | Technical Lead |
| R11 | Loss of code or UI prototype data | Operational | 2 | 3 | 6 | Continuous Git version control updates; regular backups of HTML/CSS/JS frontend files on cloud drives. | Restore from the most recent GitHub repository backup; document lost sprint items. | Technical Lead |
| R12 | Acoustic foam toxicity / Poor indoor air quality | Safety & Env. | 2 | 3 | 6 | Avoid standard petroleum-based foams; prioritize eco-efficient recycled textile-based acoustic panels or PET felt. | Replace with certified low-VOC alternative panels; test air quality via the integrated MQ-135 sensor. | Hardware Lead |
Risk Monitoring and Review
Identifying risks once is not enough — they must be tracked throughout the project development cycle:
- Weekly Risk Check during Sprint Reviews: The team reviews the register inside Jira and flags any changes in likelihood, actual costs, or component delivery delays.
- Milestone Reassessment: Before major milestones (such as the Interim Presentation, 3D Model delivery, and Final Prototype submission), the complete register is thoroughly re-evaluated.
- New Risk Intake: Any team member can propose a new risk (e.g., new constraints found during the cardboard scale model phase or software testing). The Project Manager assesses and adds it to the register.
- Closed Risks: Once a phase is fully completed and verified (e.g., R02 after buying all prototype components under the 100€ limit), the risk is marked closed but kept in the register for traceability.
Procurement
Our procurement management strategy is designed to balance technical performance, strict budgetary limits, and the use of local, sustainable resources. The goal is to maximize the quality of our proof-of-concept prototype while remaining within the €100 project budget.
- Make vs. Buy Strategy
- Buy: We adopted a “Buy” strategy for essential electronic and structural components that require professional-grade manufacturing or certification. This includes the ESP32-WROOM-32 microcontroller, high-precision sensors (BH1750, MQ-135, DHT22), the short-throw projector, and raw metal stocks (aluminum and brass). Purchasing these ensures that the core technical functionality is reliable and meets initial safety standards.
- Make: We adopted a “Make” strategy for all software logic, user interface development, detailed electronic schematics, and structural assembly. By building the backend with FastAPI and the frontend using HTML/CSS/JavaScript, we avoid costly outsourcing fees and retain full control over the user experience. The structural assembly—including the bent-metal frame and acoustic panel fitting—is performed in-house to reduce labor costs.
2. Materials, Sources, and Acquisition
Our procurement strategy prioritizes reliability and local availability to shorten lead times and reduce environmental impact:
- Electronics: Components were sourced through reputable distributors including Farnell (for the ESP32), Botnroll (for sensors and atomizers), and Aquario (for audio components and the projector). These sources were chosen for their technical documentation availability.
- Structural & Acoustic: We sourced brass and aluminum from F. Marques da Silva S.A. and acoustic materials from Artnovion. These partnerships ensure that materials meet the performance requirements for clinical environments.
- Antimicrobial Textiles: We identified the MEDIFLEX collection from Monteiro Fabrics to ensure our textiles are medical-grade and hygienic.
3. Budgeting and Timings
All acquisitions were managed in strict alignment with our sprint schedule:
- Initial Procurement: Electronic components were acquired during the first sprints to allow for early testing and code integration.
- Structural Procurement: Raw materials were purchased following the finalization of the structural drawings and SolidWorks modeling.
- Cost Monitoring: Procurement costs are strictly monitored using a Bill of Materials (BOM). Currently, our identified costs total approximately €53.91, providing a buffer against unforeseen technical needs or final prototype refinements.
Project Plan
1. Description of the project schedule and its key phases using a Gantt chart
We decided to organize the tasks according to whether they belong to:
- the initiating phase of the project (Figure 4)
- the development phases of the project (Figure 5)
- the deliverables to be submitted (Figure 6)
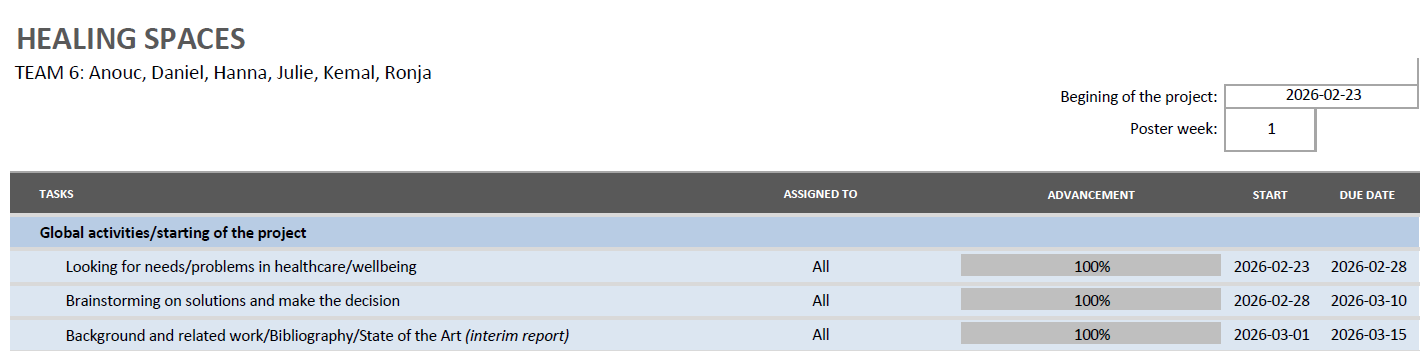
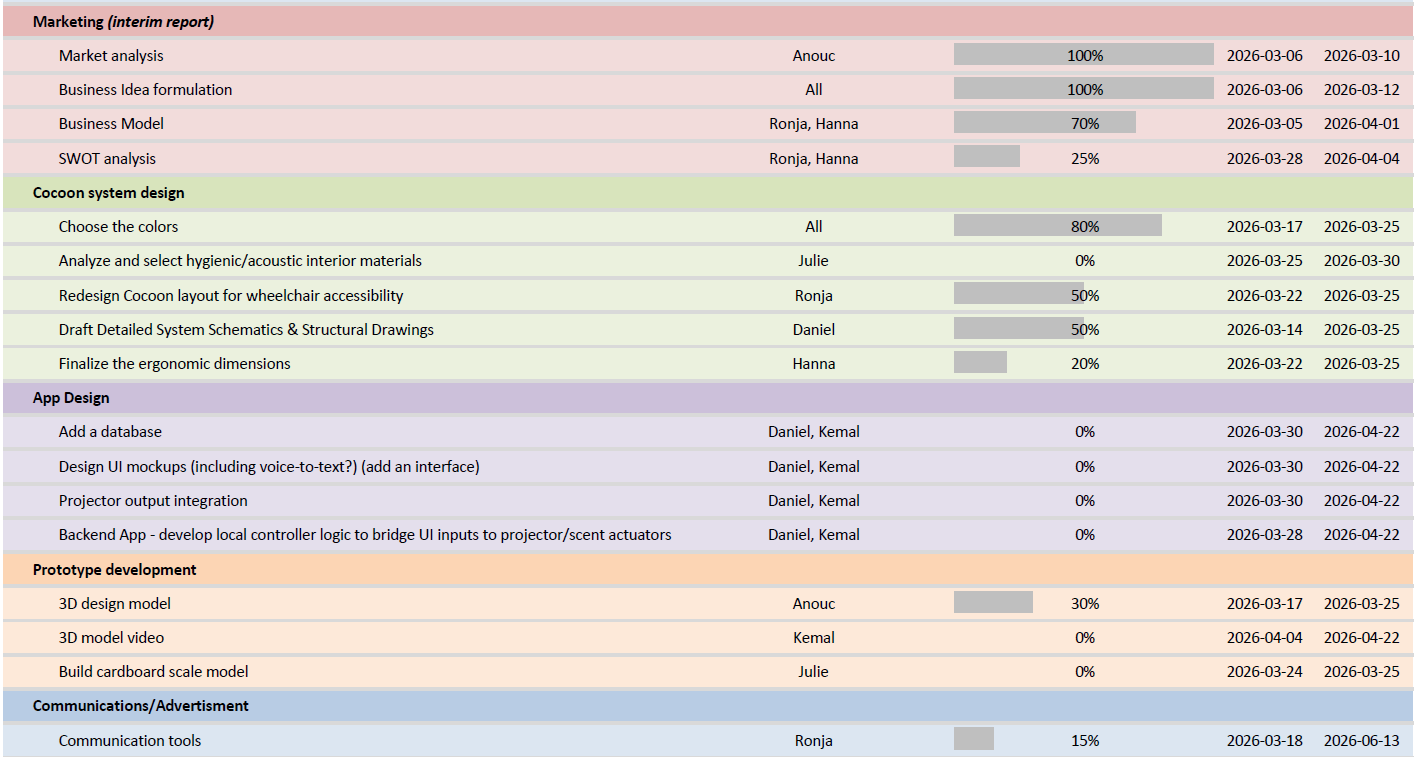
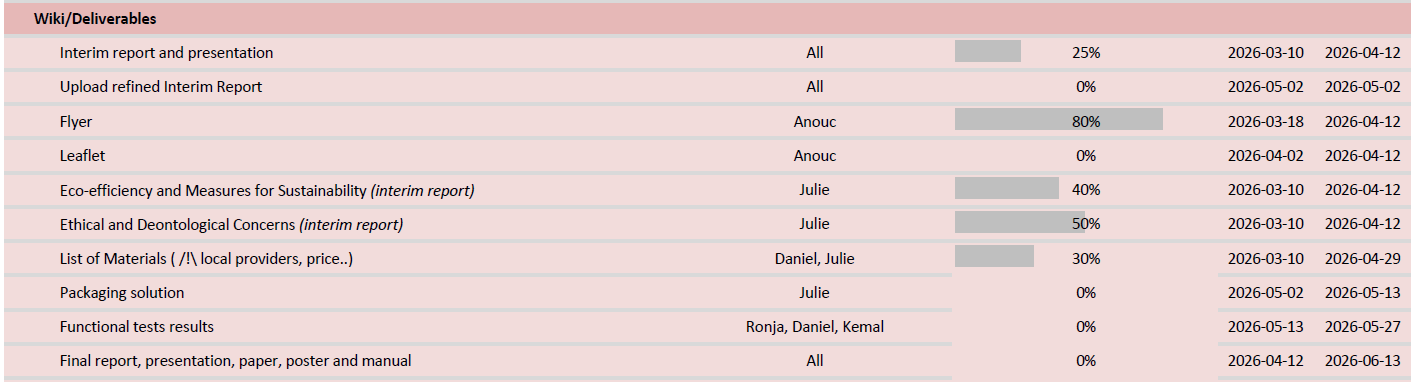
We divided the tasks according to our strengths and areas of expertise, but some compromises had to be made to meet the needs of the project's progress. For example, marketing tasks are primarily managed by Hanna and Ronja, even though their fields of study are unrelated to this topic.
Figure 7 presents the updated Gantt Chart.

Figure 8 contains the semester schedule (before the last update of the Gantt Chart for the interim report): each purple bar represents the planned time for its completion, with the start and end dates set. The gray area indicates the progress of the task, allowing us to see if we are ahead of schedule or if we still need to do more work on the task.
We observed that the beginning of the project was lengthy in terms of identifying the problem and potential solutions. Indeed, we had several different ideas, and we were only recently able to choose and focus on the final topic of our project. This required a great deal of time for reflection, discussion, and research, some of which were successful, others not. We now have to complete numerous tasks within the same timeframe, some with imminent deadlines; these are the tasks we must focus on first.

2. Sprint backlog and sprints created in Planner on Jira:
First of all, discovering and using Jira was not easy for our team. Despite the explanations that we thought we understood, some parameters and steps were not completed successfully on time, notably the timely launch of certain sprints.
Figure 9 is one of the first sprint we organized (but forgot to launch it on time).
Figure 10 is the last sprint we launched, which takes place from April 7th to 14th.
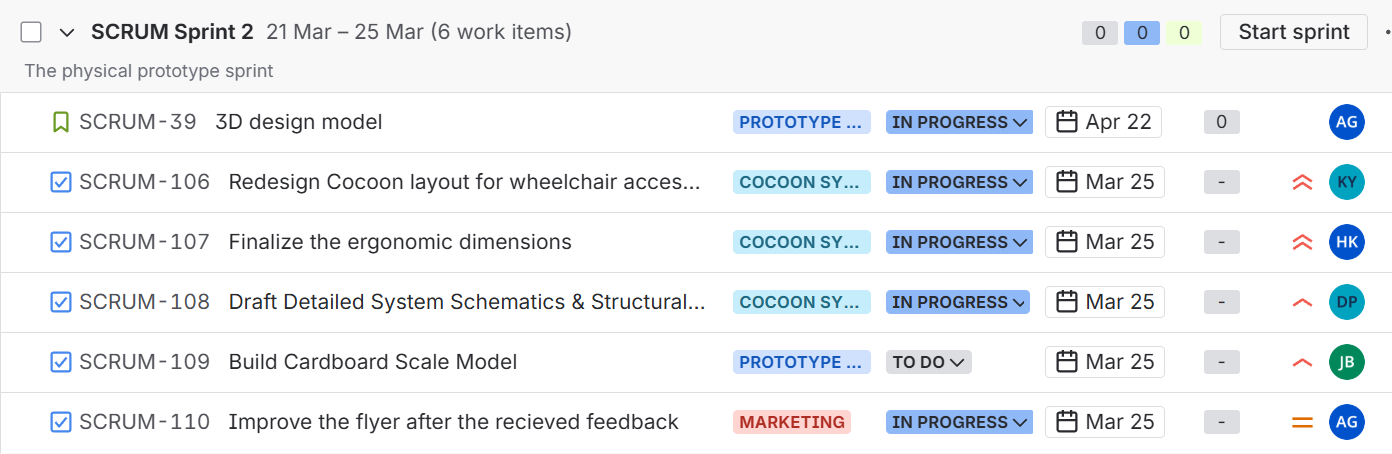
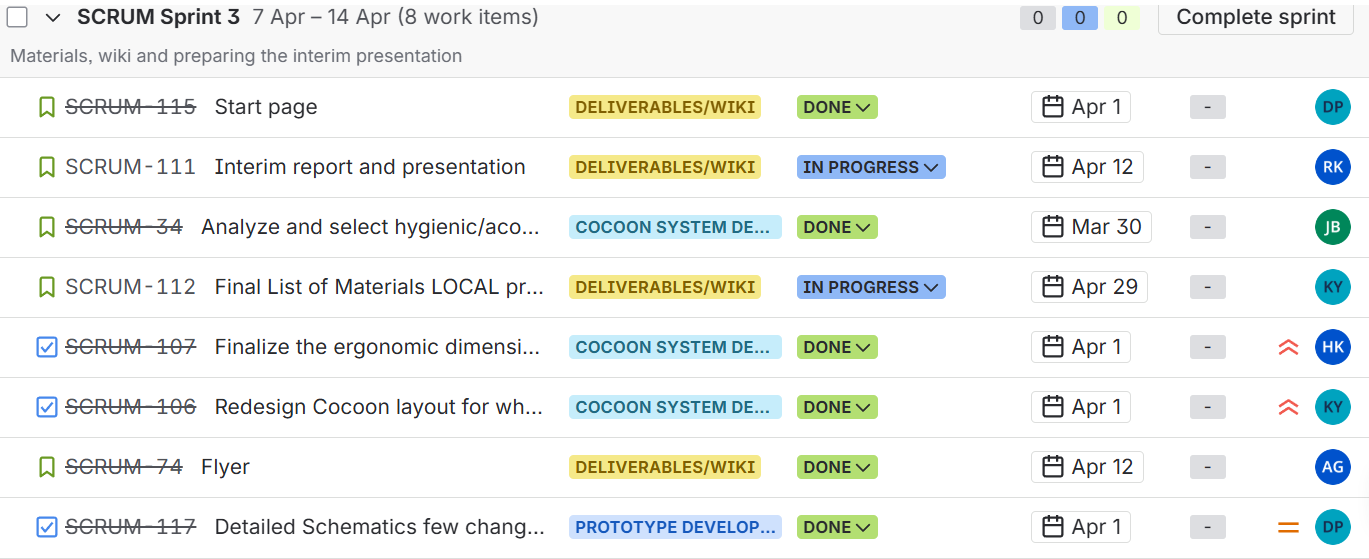
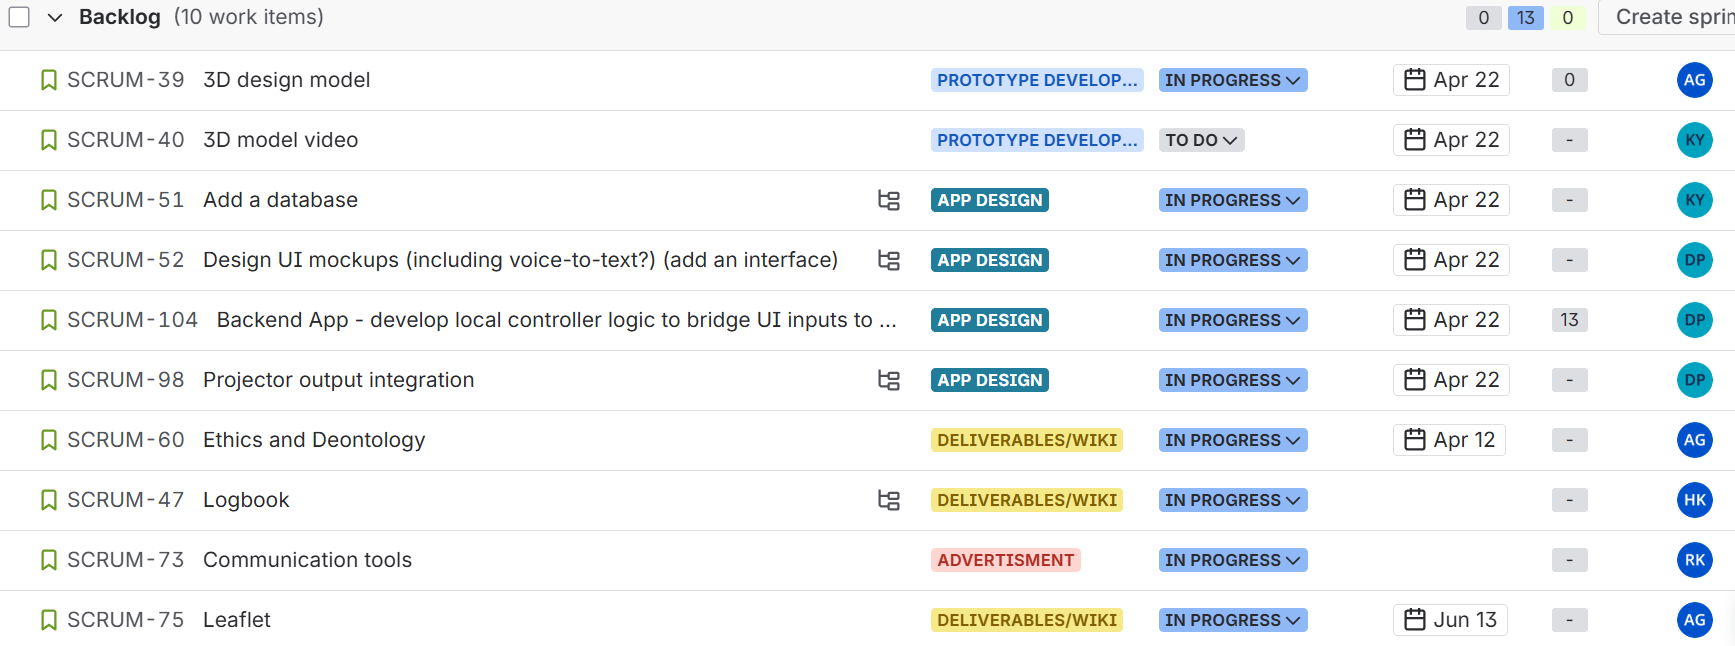
Figure 11 is the curent backlog (edited on April 9th) with tasks that still need to be completed.
3. Prioritization, estimation process and underlying challenges
We tried to prioritize tasks based on the deadlines and deliverables to respect, but it was also based on our estimated workload and the time it would take.
The tricky part was finding compromises based on each person's areas of expertise and the time the tasks could take.
Provide a summary of the sprints that were executed, along with sprint goals.
Sprint Outcomes
Include the outcomes of all sprint reviews (what was the sprint backlog, completion status, planned capacity vs. achieved velocity).
Our team took some time to get to grips with Jira properly (especially launching sprints to record them, assigning story points and managing priorities, retrospectives and dailies), so we are detailing the 3 most recent sprints here (8, 9 and 10) since they best correspond to the requests.
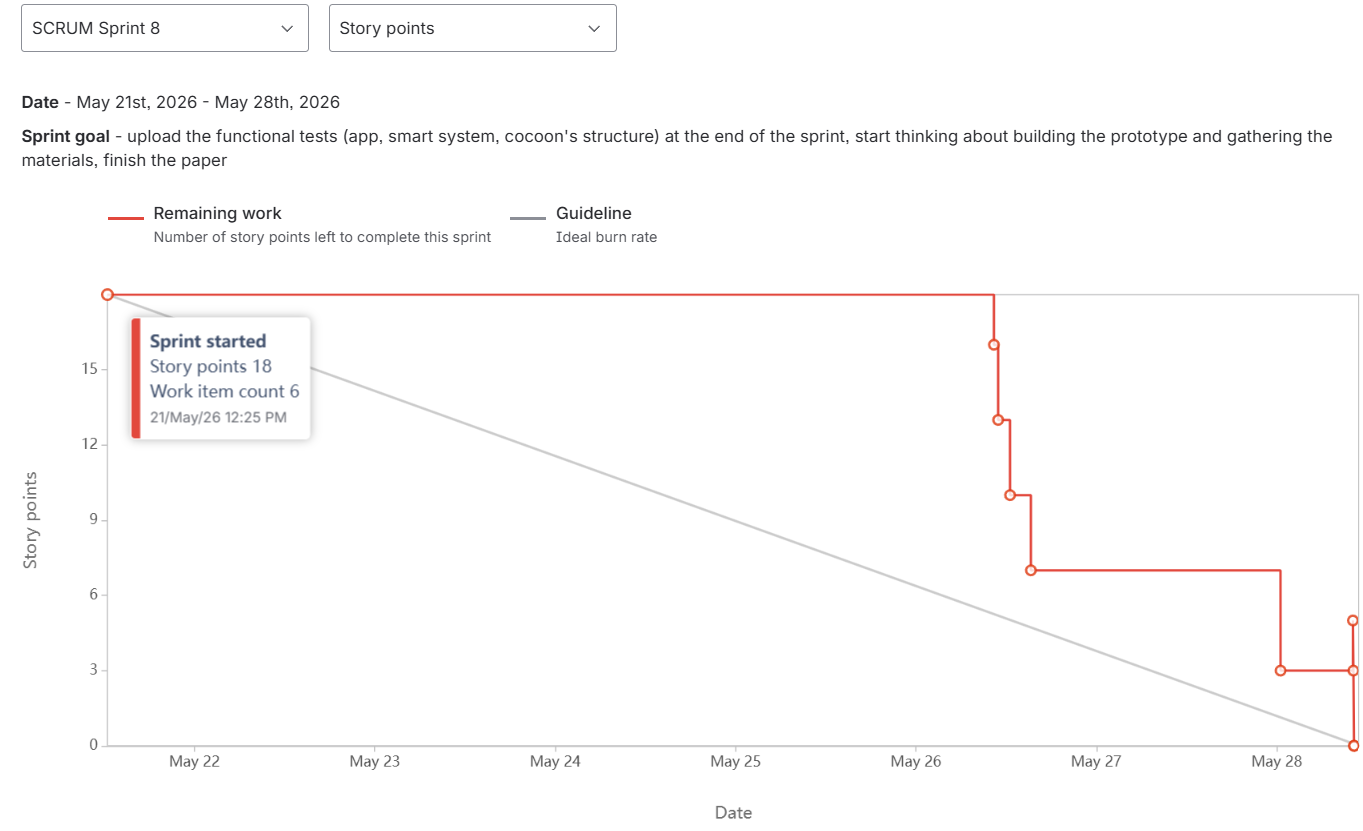
Sprint 8: May 21st - 28th 2026
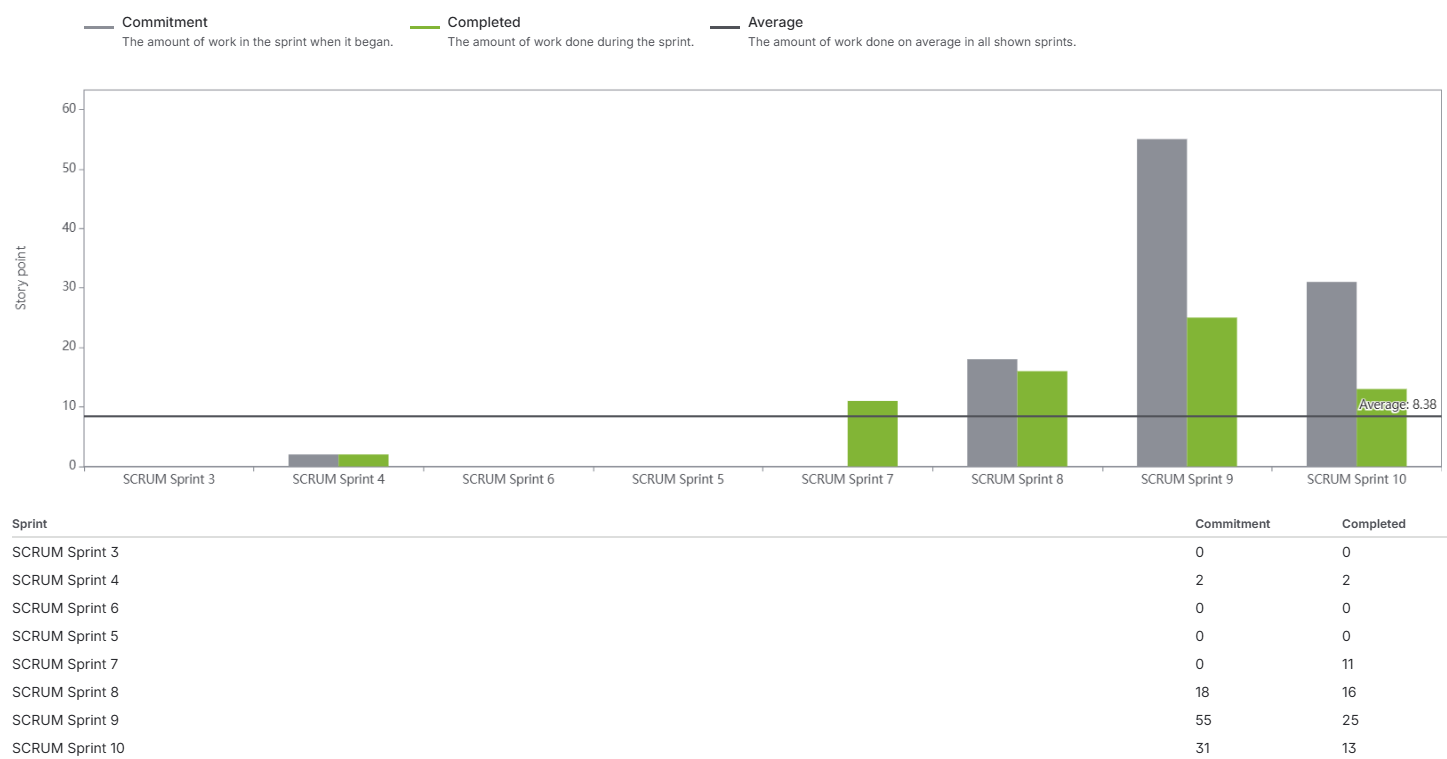
During this sprint, the team focused on uploading the functional tests on wiki (app, smart system, cocoon's structure), start thinking about building the prototype and gathering the materials, and improving the paper. Looking at Figure 12, we can see that all planned tasks were completed, and that the story point estimates were appropriate. The small spike in story points at the end of the diagram (Figure 12) indicates that we added story points to a task at the end of the sprint, and consequently, the velocity report in Figure 15 shows that 16 out of 18 story points were completed, even if all tasks were done.
Sprint 9: May 28th - June 4th 2026
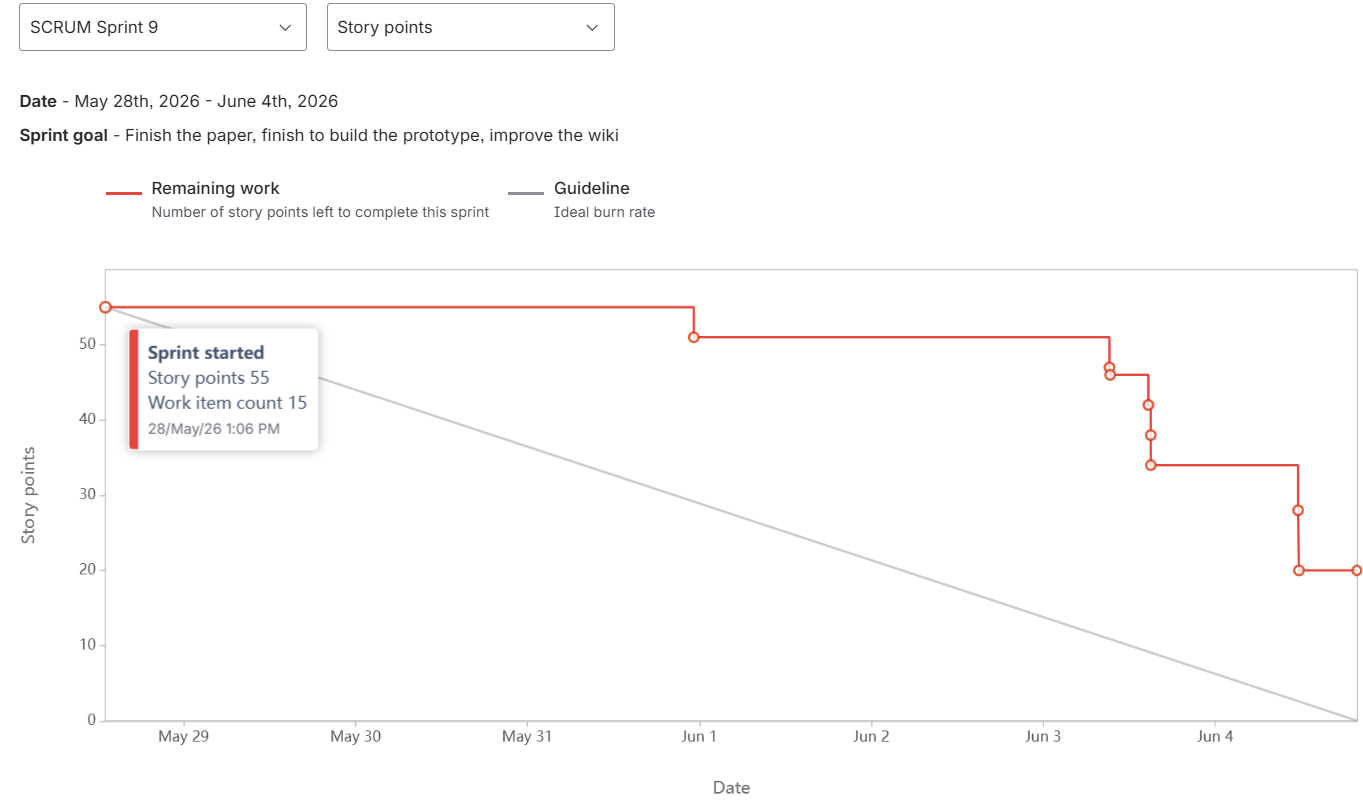
During this sprint, the team focused on finishing the paper, finishing to build the prototype, and continuing to improve the wiki.
Looking at Figure 13, the diagram's appearance is quite satisfactory as it shows the fairly regular completion of tasks; however, we were unable to complete all the story points: our estimate was too high relative to our workload capacity. Having completed all the tasks and story points of the last sprint 8, we wanted to increase the number of committed story points. Having completed 25 out of 55 story points (which is more than in the last sprint, as shown in Figure 15), we now need to try to determine our story point velocity to better plan future sprints.
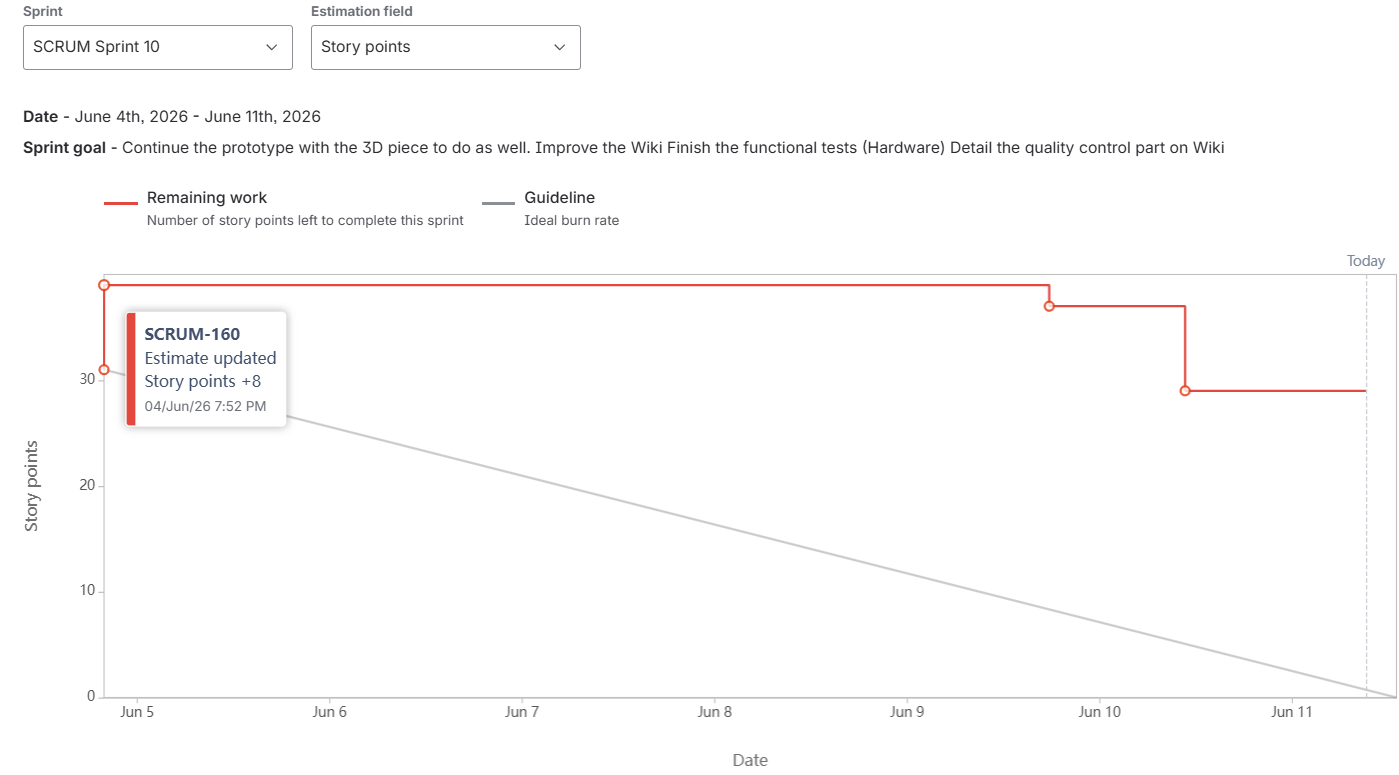
Sprint 10: June 4th - June 11th 2026
During this sprint, the team focused on continuing the prototype with the 3D piece to do as well. Improving the Wik, finishing the functional tests (Hardware), and finishing to detail the quality control part on Wiki.
Looking at Figure 14, the diagram's appearance is not really satisfactory as it shows, first of all, that we added story points after the sprint had already started, and that we didn't even complete half of the planned story points. This week was packed with tasks and story points. We still managed to complete the most important tasks, although only 13 out of the 31 (as shown in Figure 15).
The velocity report in Figure 15 shows the number of story points planned and completed for each sprint. It indicates an average of 8.38 completed story points, but this doesn't truly represent our actual story point completion rate. We need to average the last three sprints completed successfully. Our average story points completed is then 18 for the last three sprints. We would need to complete more sprints to obtain an average that accurately reflects our true capacity, and thus be able to properly plan task completion during sprints.
Sprint Evaluations
This section provides a retrospective analysis of each sprint, highlighting successes, challenges, and opportunities for improvement. It examines team performance, project progress, and lessons learned, with the objective of continuously improving future sprint planning and execution.
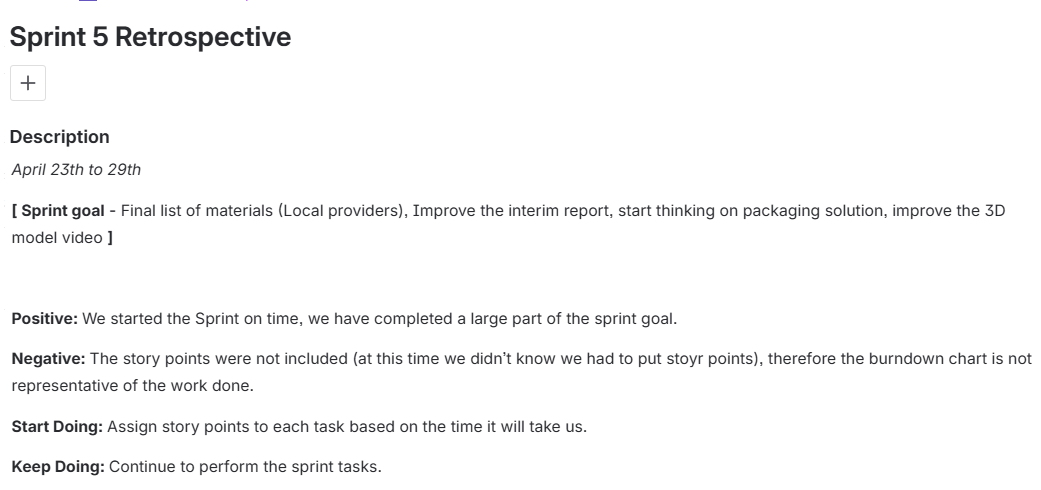
Sprint 5
Looking at Figure 16, the team successfully started the sprint on time and completed the planned tasks. This sprint marked the beginning of the transition toward a more structured Agile approach, as the team recognized the need to introduce story points and improve sprint tracking.
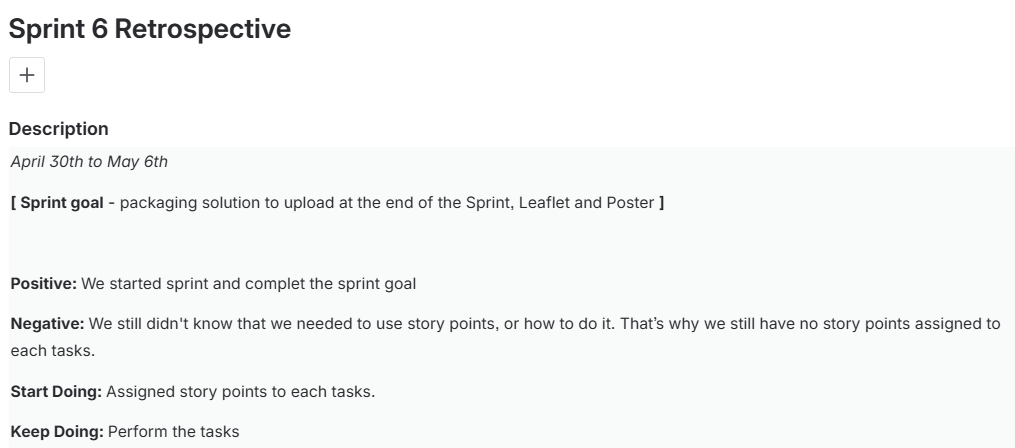
Sprint 6
Looking at Figure 17, the team achieved most of the sprint goals and made progress on key deliverables such as documentation and testing activities. However, the retrospectives identified issues with adding story points after the sprint had already started, which reduced the accuracy of planning and the burndown chart.
Sprint 7
Looking at Figure 18, this sprint showed continued improvement in the use of story points and burndown tracking. The team delivered several planned outputs, but task progress was not always updated during the sprint, making it harder to monitor real-time performance.
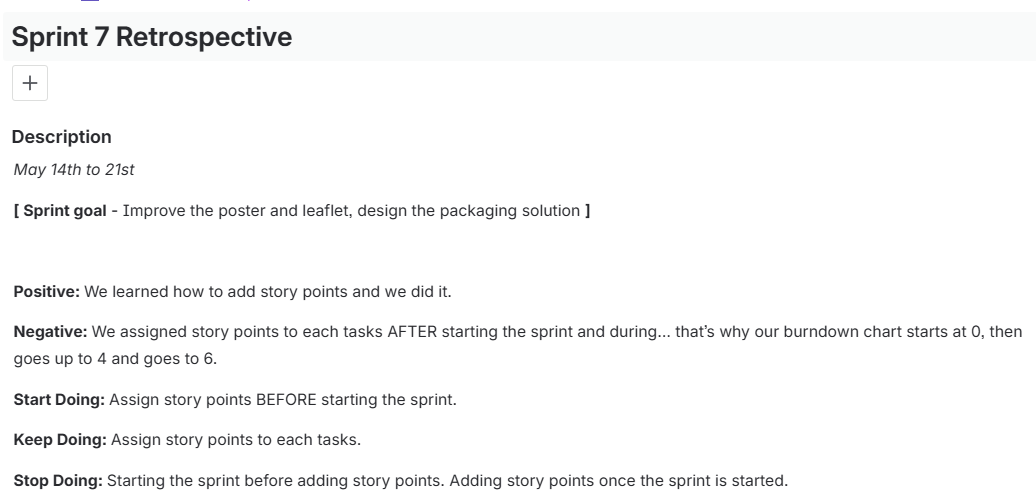
Sprint 8
Looking at Figure 19, the team made strong progress on major deliverables, including prototype-related work and communication materials. At the same time, planning accuracy remained a challenge, as the sprint workload was overestimated compared with the team’s actual capacity.
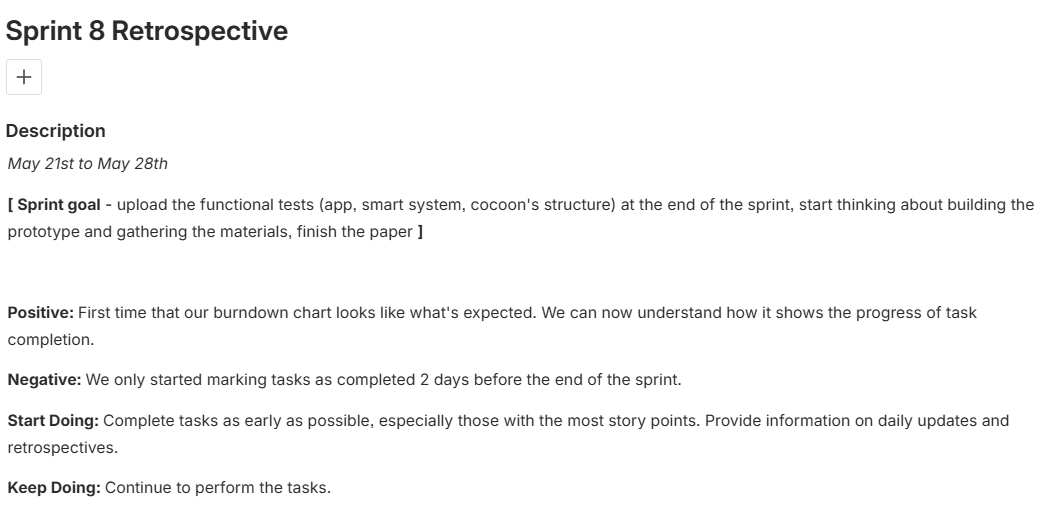
Sprint 9
Looking at Figure 20, the retrospectives highlighted better collaboration and more consistent use of Agile practices. The team continued delivering important technical results, but external dependencies and hardware constraints created delays for some tasks.
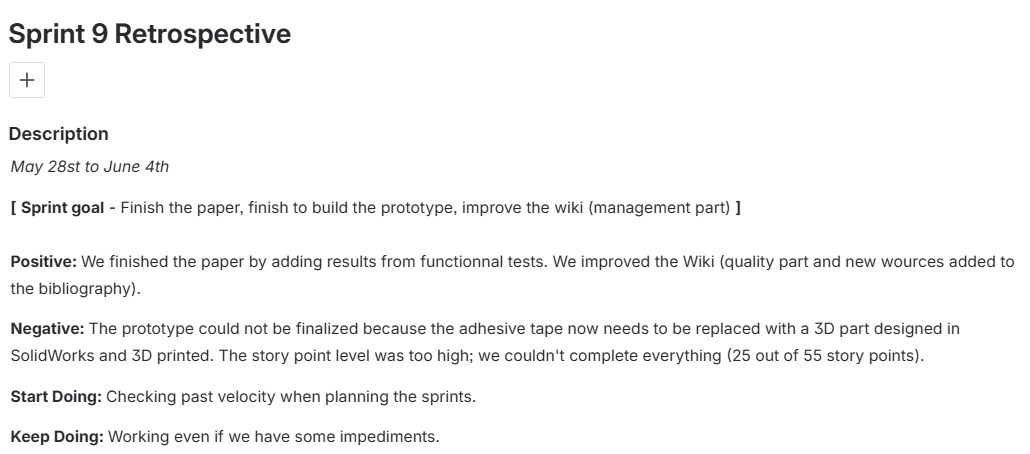
Sprint 10
Looking at Figure 21 the team successfully completed several planned tasks, including designing the 3D part in SolidWorks, improving the quality control section of the Wiki, and finalizing the project video. However, the prototype assembly was delayed because we were waiting for validation of the 3D-printed component. We also observed that adding story points after the sprint had started negatively impacted the burndown chart. For future sprints, we aim to improve our planning by using previous sprint velocity to estimate workloads more accurately while continuing to make progress despite technical constraints.
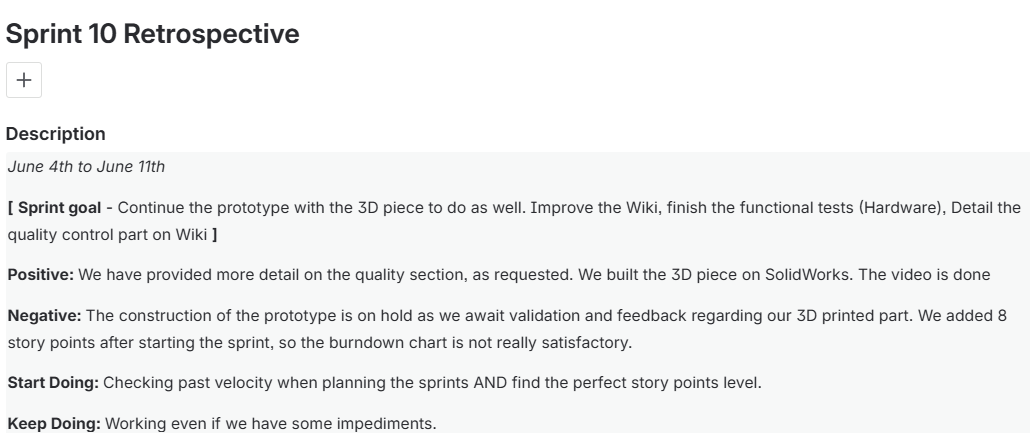
Retrospective Summary
Throughout the project, the team demonstrated a strong ability to achieve sprint objectives and continuously improve both technical deliverables and project documentation. Significant progress was made in prototype development, testing, reporting, and communication materials, while the team also showed resilience in overcoming technical challenges and external constraints.
The team successfully started the sprint on time and completed the planned tasks. This sprint marked the beginning of the transition toward a more structured Agile approach, as the team recognized the need to introduce story points and improve sprint tracking.
Summary
This chapter summarised the project management approach used for developing the Healing Cocoon prototype, a proof-of-concept designed to reduce anxiety in children in clinical waiting environments. The project scope focused on research, design, and development, organised using a Work Breakdown Structure (WBS) to structure tasks and responsibilities.
The project was managed through short, structured development cycles with weekly planning sessions and Jira task tracking, enabling steady progress and flexibility over the 15-week timeline. The project was completed within a €100 budget by prioritising low-cost materials and components while maintaining core functionality.
Quality was ensured through iterative testing, supervisor feedback, and a focus on safety, hygiene, accessibility, and reliability. Key stakeholders, including healthcare professionals, patients, supervisors, and suppliers, were considered throughout development.
Communication was maintained using WhatsApp, Microsoft Teams, Outlook, and Jira to support effective collaboration. Risks were continuously identified and mitigated, while procurement decisions balanced cost, performance, and availability.
Overall, this structured and iterative development process, supported by continuous feedback, allowed the team to deliver a functional prototype within the defined constraints of scope, time, cost, and quality.